How to Use Analytics to Inform Your Next Research Method
- Philip Burgess
- Dec 25, 2025
- 3 min read

By Philip Burgess | UX Research Leader
When I first started designing research projects, I often relied on intuition or traditional methods without much reflection on what data could tell me about my approach. Over time, I realized that analytics could be a powerful tool to guide my decisions about which research methods to use next. Using analytics not only saves time and resources but also improves the quality and relevance of research outcomes.
In this post, I’ll share how I use analytics to shape my research methods, with practical steps and examples you can apply to your own projects.
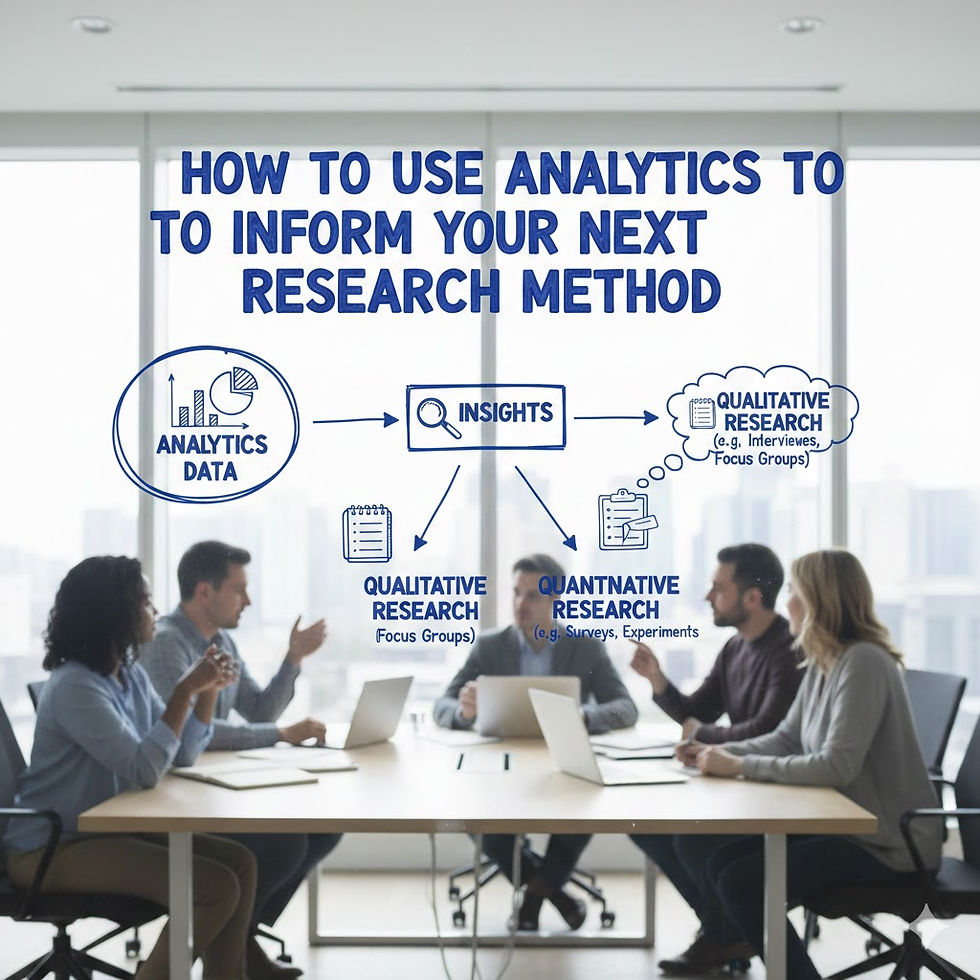
Understanding Analytics in Research
Analytics refers to the process of collecting, analyzing, and interpreting data to make informed decisions. In research, analytics can help identify patterns, trends, and gaps in existing data that influence the choice of research methods.
For example, if analytics show that survey responses are low or biased, it might indicate the need for qualitative interviews instead. Or if data reveals a complex relationship between variables, a mixed-methods approach could be more effective.
Analytics is not just about numbers; it’s about using data insights to tailor your research design for better results.
How I Use Analytics to Choose Research Methods
Review Past Data Quality and Completeness
Before deciding on a new research method, I examine the quality of data from previous studies or pilot tests. Analytics tools can highlight missing data, inconsistencies, or areas with insufficient responses.
If I notice large gaps or unreliable data in quantitative surveys, I consider switching to methods like focus groups or case studies that provide richer context. Conversely, if qualitative data lacks generalizability, I might add structured questionnaires to capture broader trends.
Analyze Participant Behavior and Engagement
Analytics can track how participants interact with surveys, experiments, or digital platforms. For instance, high dropout rates or skipped questions in an online survey signal that the method might be too long or confusing.
By analyzing these engagement metrics, I adjust my research method to improve participation. This might mean shortening surveys, using more engaging formats, or choosing in-person interviews where participants feel more comfortable.
Identify Trends and Patterns in Existing Data
Sometimes, analytics reveal unexpected trends that suggest new research angles or methods. For example, if data shows a sudden shift in user behavior or preferences, I might design longitudinal studies to explore changes over time.
Analytics can also uncover correlations that need deeper exploration through qualitative methods like ethnography or narrative analysis.
Practical Steps to Use Analytics Effectively
Set clear research goals
Define what you want to learn before diving into data. Clear goals help focus your analytics on relevant metrics.
Choose the right analytics tools
Use software that fits your data type and research context. Tools like Excel, Google Analytics, or specialized research platforms can provide valuable insights.
Visualize data for easy interpretation
Charts, heat maps, and dashboards make it easier to spot patterns and communicate findings to your team.
Combine quantitative and qualitative data
Use analytics to integrate different data types for a fuller picture. For example, combine survey statistics with interview transcripts.
Test and iterate
Use analytics to evaluate pilot studies and refine your methods before full-scale research.
Example: Improving a Customer Feedback Study
In one project, I used analytics to improve a customer feedback survey. Initial data showed many incomplete responses and low engagement. By analyzing where participants dropped off, I shortened the survey and added interactive elements.
After these changes, analytics showed a 40% increase in completion rates and richer data quality. I also incorporated follow-up interviews based on analytics insights about customer concerns, which provided deeper understanding.

Avoiding Common Pitfalls
Don’t rely solely on analytics without considering context. Numbers tell part of the story but not everything.
Avoid overcomplicating your analysis. Focus on key metrics that align with your research goals.
Be mindful of data privacy and ethics when collecting and analyzing participant data.
Use analytics as a guide, not a strict rule. Flexibility in research design remains important.
Final Thoughts
Using analytics to inform your next research method transforms how you approach data collection and analysis. It helps you choose methods that fit your goals, improve participant engagement, and generate meaningful insights.


Comments